Benchmarks tell you whether a campaign is healthy or quietly bleeding budget. Singapore is a mature, high purchasing power market, which means higher CPCs than the rest of Southeast Asia and little room for sloppy targeting. This guide collects the 2026 Singapore benchmarks across every major channel, then shows how to use and beat them.
How to read this: Benchmarks are ranges, not targets. Use them to spot outliers in your own account, then optimise. Your own historical data always beats a market average.
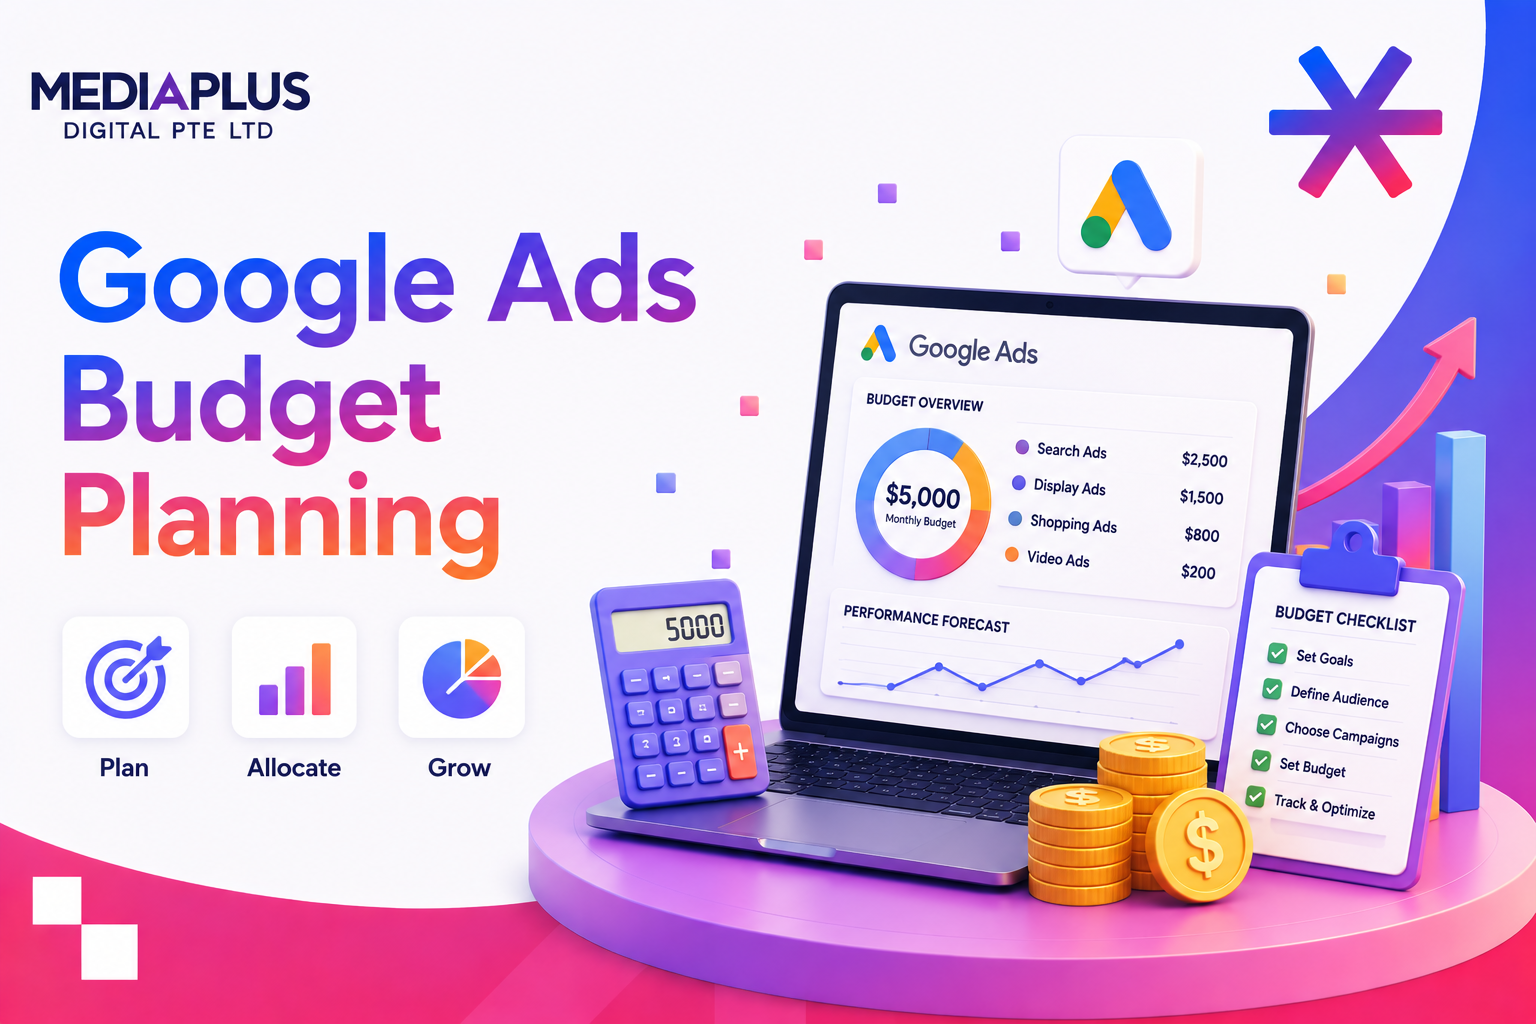
Paid Search: Google Ads (Singapore 2026)
|
Metric |
Range |
|
CTR |
3.5% to 6.5% across industries |
|
CPC |
SGD 1.50 to 5.00, over SGD 15 for finance, legal, enterprise software |
|
Conversion rate (lead gen) |
2.5% to 5.5% |
|
Conversion rate (e-commerce) |
1.5% to 3.5% |
Professional services and education see higher CTRs. Insurance and legal see lower CTRs due to competition.
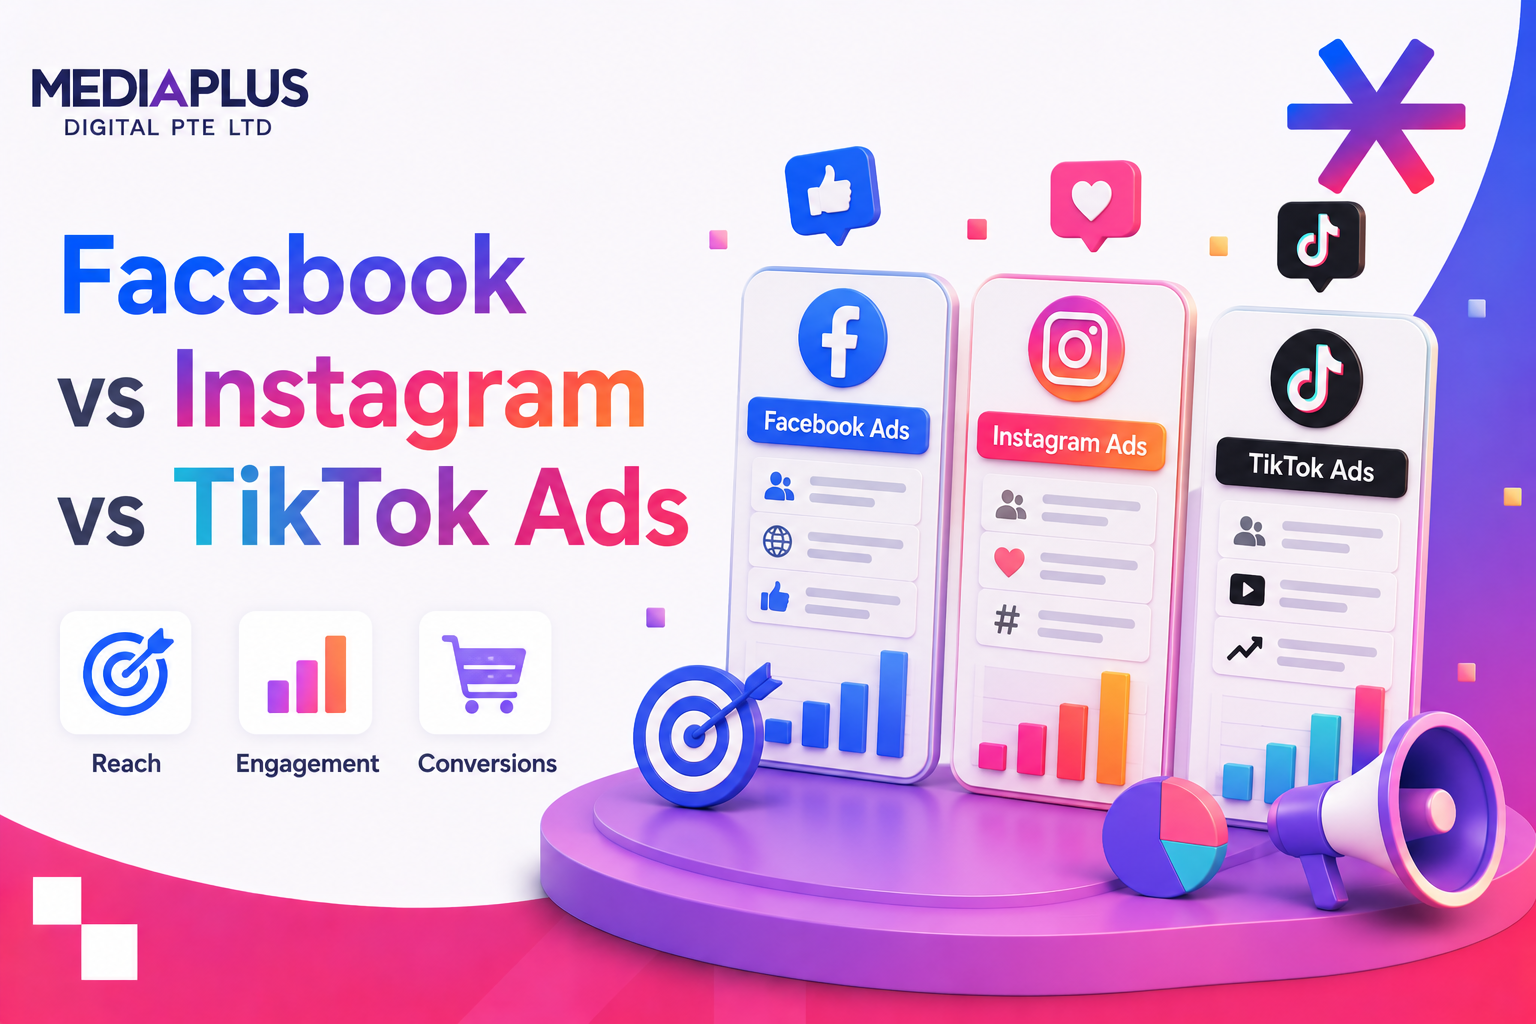
Paid Social: Meta and LinkedIn
|
Platform / metric |
Range |
|
Meta CTR (feed) |
0.8% to 1.8% |
|
Meta CPC |
SGD 0.80 to 2.50, lower in retargeting |
|
Meta conversion (warm / cold) |
2% to 4% warm, 0.5% to 1.5% cold |
|
LinkedIn CPC |
SGD 5.00 to 12.00 |
|
LinkedIn CTR (sponsored) |
0.4% to 0.7% |
|
LinkedIn conversion (B2B) |
2% to 5% well-targeted |
SEO and Organic Search
|
Metric |
Range |
|
Organic CTR position 1 |
28% to 32% informational, 18% to 24% commercial |
|
Organic CTR position 2 |
14% to 18% |
|
Organic CTR position 3 |
9% to 12% |
|
Organic CTR beyond position 5 |
Below 5% |
|
YoY organic traffic growth |
15% to 30% (established sites) |
|
Bounce rate |
40% to 60% blog, 30% to 50% product or service |
|
Average session duration |
2 to 4 min content, 1 to 2 min service pages |
Email Marketing
|
Metric |
Range |
|
Open rate |
20% to 30% (28% to 35% education, 18% to 24% retail) |
|
CTR |
2% to 4.5% (5% to 8% highly segmented) |
|
Unsubscribe rate |
Below 0.3% healthy, above 0.5% signals fatigue |
|
Conversion rate |
2% to 5% e-commerce, 5% to 10% lead gen |
Apple Mail Privacy Protection inflates open rates, so treat them directionally.
Social Engagement
|
Platform |
Engagement rate |
Note |
|
|
1.5% to 3.5% |
Reels reach 2x to 3x static posts |
|
|
0.5% to 1.5% |
Video under 60s performs best |
|
|
1.0% to 2.5% |
Employee advocacy 3x to 5x company posts |
|
TikTok |
3% to 7% |
Follower growth has slowed vs 2023 to 2024 |
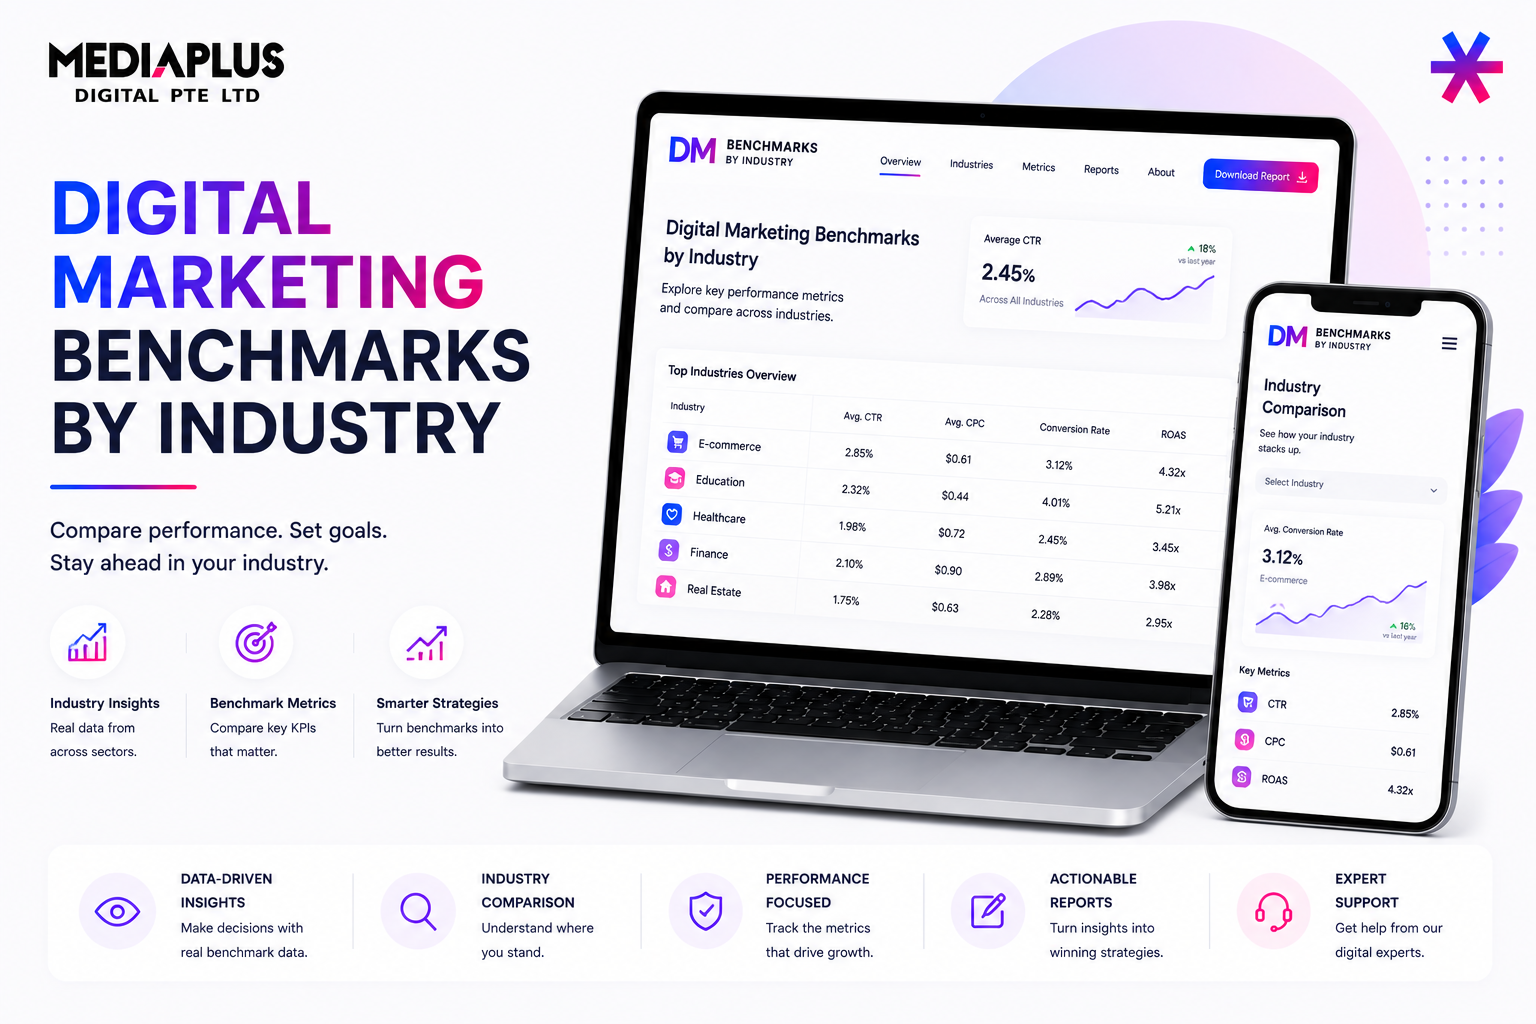
Benchmarks by Industry (Singapore)
|
Industry |
Search CPC (SGD) |
Search CTR |
Conversion rate |
Email open |
|
Financial services |
5 to 15 |
2.5% to 4% |
4% to 7% qualified |
25% to 32% |
|
E-commerce and retail |
0.80 to 3.00 |
3% to 6% |
1.5% to 3.5% |
18% to 24% |
|
Education and training |
2 to 6 |
4% to 7% |
3% to 6% |
28% to 35% |
|
Technology and SaaS |
4 to 10 |
3% to 5% |
5% to 10% trial to paid |
22% to 30% |
|
Healthcare and wellness |
1.50 to 5.00 |
3.5% to 6% |
3% to 6% |
25% to 32% |
|
Legal services |
5 to 15+ |
2.5% to 4% |
3% to 6% |
20% to 28% |
Note on healthcare and SaaS: Healthcare relies heavily on E-E-A-T for SEO; SaaS has longer cycles where LinkedIn is the strongest social channel.
Budget and CAC Guidance
|
Business stage |
Marketing as % of revenue |
Split |
|
Established (5+ years) |
5% to 10% |
About 60% digital, 40% brand and offline |
|
Growth-stage SME |
12% to 20% |
70%+ to measurable digital |
|
Early-stage |
Fixed SGD 2,000 to 5,000 per month |
Test two channels |
- B2C customer acquisition cost: target 20% to 30% of first-year customer value.
- B2B SaaS and professional services: aim for a 12 to 18 month CAC payback.
How to Use These Benchmarks
- Pull your own CTR, CPC, conversion rate, and ROAS by campaign.
- Compare like with like: same industry and business model.
- Find your weakest metric versus the range.
- Diagnose: low CTR points to creative or relevance, high CPC to competition or Quality Score, low conversion to landing pages.
- Fix one lever, re-measure, and prioritise your own trend over the market average.
How to Beat the Benchmarks
- Lift CTR with tighter ad-to-keyword relevance and stronger creative.
- Lower CPC by improving Quality Score and pruning wasteful queries.
- Raise conversion rate with conversion rate optimisation and faster, clearer landing pages.
- Cut acquisition cost with retargeting and first-party audiences. See how to increase website conversion rate.
Caveats and Sources
These figures are aggregated industry benchmarks (drawing on sources such as WordStream, Databox, Search Engine Journal, Mailchimp, Hootsuite, and Singapore bodies including IMDA and the Singapore Business Federation). They are self-reported and subject to survivorship bias and tracking differences. Treat them as directional, update them annually, and replace them with your own account data wherever you have it.
Platform Cost Deep-Dives
For channel detail, see Google Ads cost, Facebook Ads cost, Instagram Ads cost, TikTok advertising cost, and YouTube Ads cost.
Benchmark Your Campaigns With Experts
MediaPlus audits and improves campaign performance through our digital marketing agency and SEM services. Get in touch for a free benchmark review.
Related Reads