A slow website costs you money quietly. There is no error message, no alert, just visitors who leave before your page finishes loading and enquiries that never arrive. More than half of mobile users abandon a page that takes longer than three seconds to load, and in Singapore, where over 60% of web traffic is mobile, that is most of your audience.
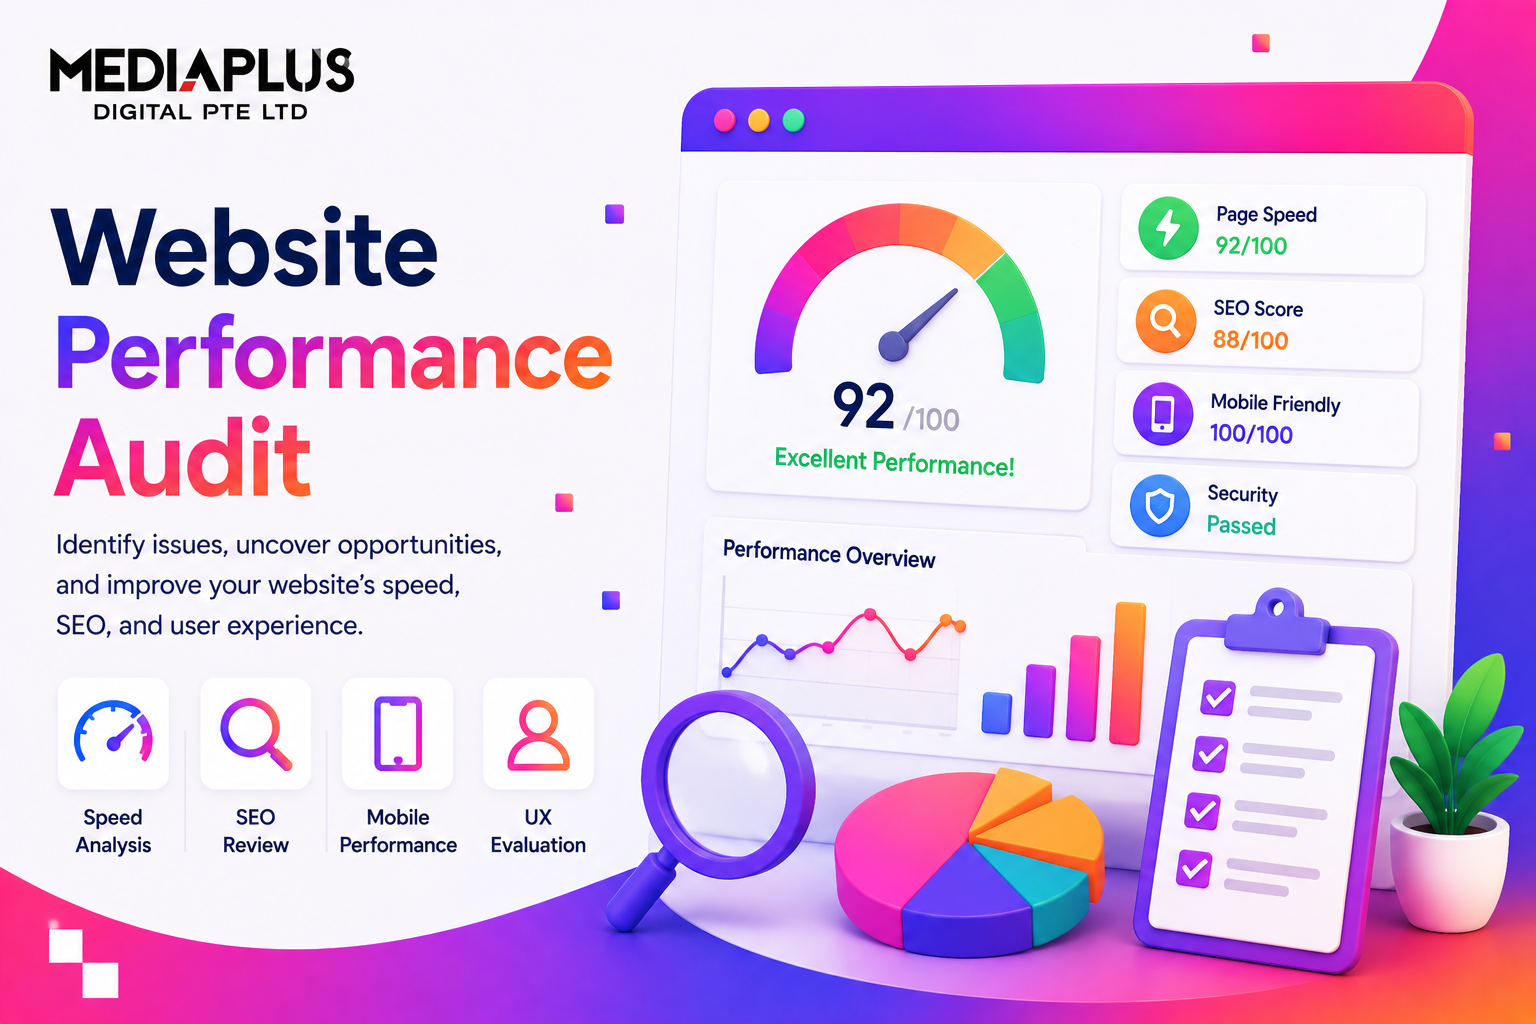
A website performance audit is how you find and fix what is slowing you down. It is a structured evaluation of your site’s speed, responsiveness, stability, and technical health, run with real measurement tools rather than guesswork. This guide walks through exactly what to check, which tools to use, the thresholds that matter, and how to turn findings into fixes.
What a Website Performance Audit Actually Is
A performance audit measures how fast and reliably your site loads and responds for real users, then identifies the specific causes of any slowness. It overlaps with, but is narrower than, a full website audit. A full audit also covers content, backlinks, and on-page SEO. A performance audit focuses on the technical experience: load speed, interactivity, visual stability, mobile behaviour, and the server and code factors behind them.
It matters for three connected reasons:
- Conversions. Faster pages keep more visitors and convert more of them. Speed is a direct revenue lever, which is why it pairs naturally with conversion rate optimisation.
- SEO. Google uses page experience signals, including Core Web Vitals, as ranking factors. Slow sites lose ground to faster competitors.
- Brand trust. A sluggish or janky site signals neglect, even when the underlying business is excellent.
The Metrics That Matter: Core Web Vitals and More
Before auditing, you need to know what “good” looks like. These are the targets Google holds your pages to.
|
Metric |
What it measures |
Good |
Needs work |
Poor |
|
LCP (Largest Contentful Paint) |
Time for the main content to load |
Under 2.5s |
2.5s to 4.0s |
Over 4.0s |
|
INP (Interaction to Next Paint) |
How quickly the page responds to input |
Under 200ms |
200ms to 500ms |
Over 500ms |
|
CLS (Cumulative Layout Shift) |
Visual stability (unexpected movement) |
Under 0.1 |
0.1 to 0.25 |
Over 0.25 |
|
FCP (First Contentful Paint) |
Time to first visible element |
Under 1.8s |
1.8s to 3.0s |
Over 3.0s |
|
TTFB (Time to First Byte) |
Server response speed |
Under 0.8s |
0.8s to 1.8s |
Over 1.8s |
LCP, INP, and CLS are the three official Core Web Vitals. FCP and TTFB are diagnostic metrics that help explain why a Core Web Vital is failing. INP replaced the older First Input Delay metric and is now the standard responsiveness measure.
One important distinction: lab data vs field data. Lab tools (Lighthouse, PageSpeed Insights “analysis”) simulate a load in a controlled environment. Field data (the Chrome User Experience Report, shown in Search Console) reflects what real visitors actually experienced over the past 28 days. Google ranks on field data, so treat lab scores as diagnostics and field data as the verdict.
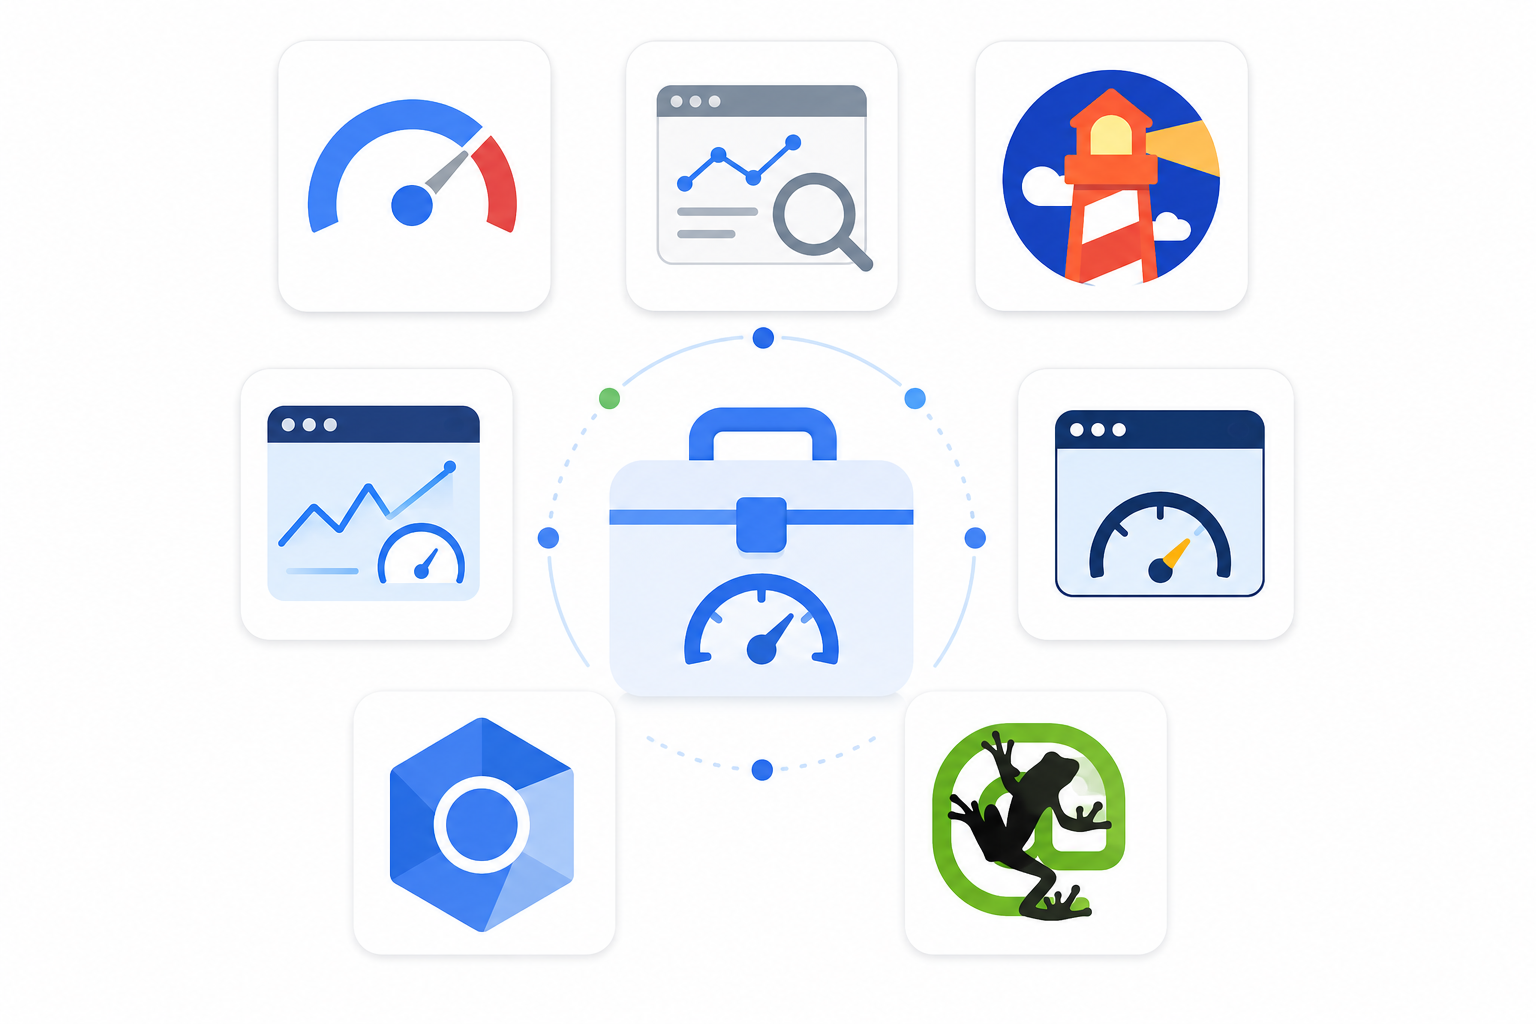
The Tools You Need
You can run a thorough audit with free tools. Here is the practical stack.
|
Tool |
What it gives you |
Cost |
|
Google PageSpeed Insights |
Core Web Vitals (lab + field), prioritised fix list per URL |
Free |
|
Google Search Console |
Site-wide Core Web Vitals report on real-user data, indexing health |
Free |
|
Lighthouse (Chrome DevTools) |
Deep performance, accessibility, and best-practice audit per page |
Free |
|
GTmetrix |
Waterfall charts, load timing breakdown, historical monitoring |
Free tier |
|
WebPageTest |
Advanced multi-location, multi-device testing with filmstrips |
Free |
|
Chrome DevTools (Network + Performance tabs) |
Request-by-request analysis of what loads and when |
Free |
|
Screaming Frog / Sitebulb |
Site-wide crawl for broken links, redirects, large resources |
Free tier / paid |
For most Singapore SMEs, PageSpeed Insights plus Search Console plus Lighthouse cover 90% of the job. Always test from a Singapore or regional connection where possible, since distance to your server affects results.
Step-by-Step: How to Run a Website Performance Audit
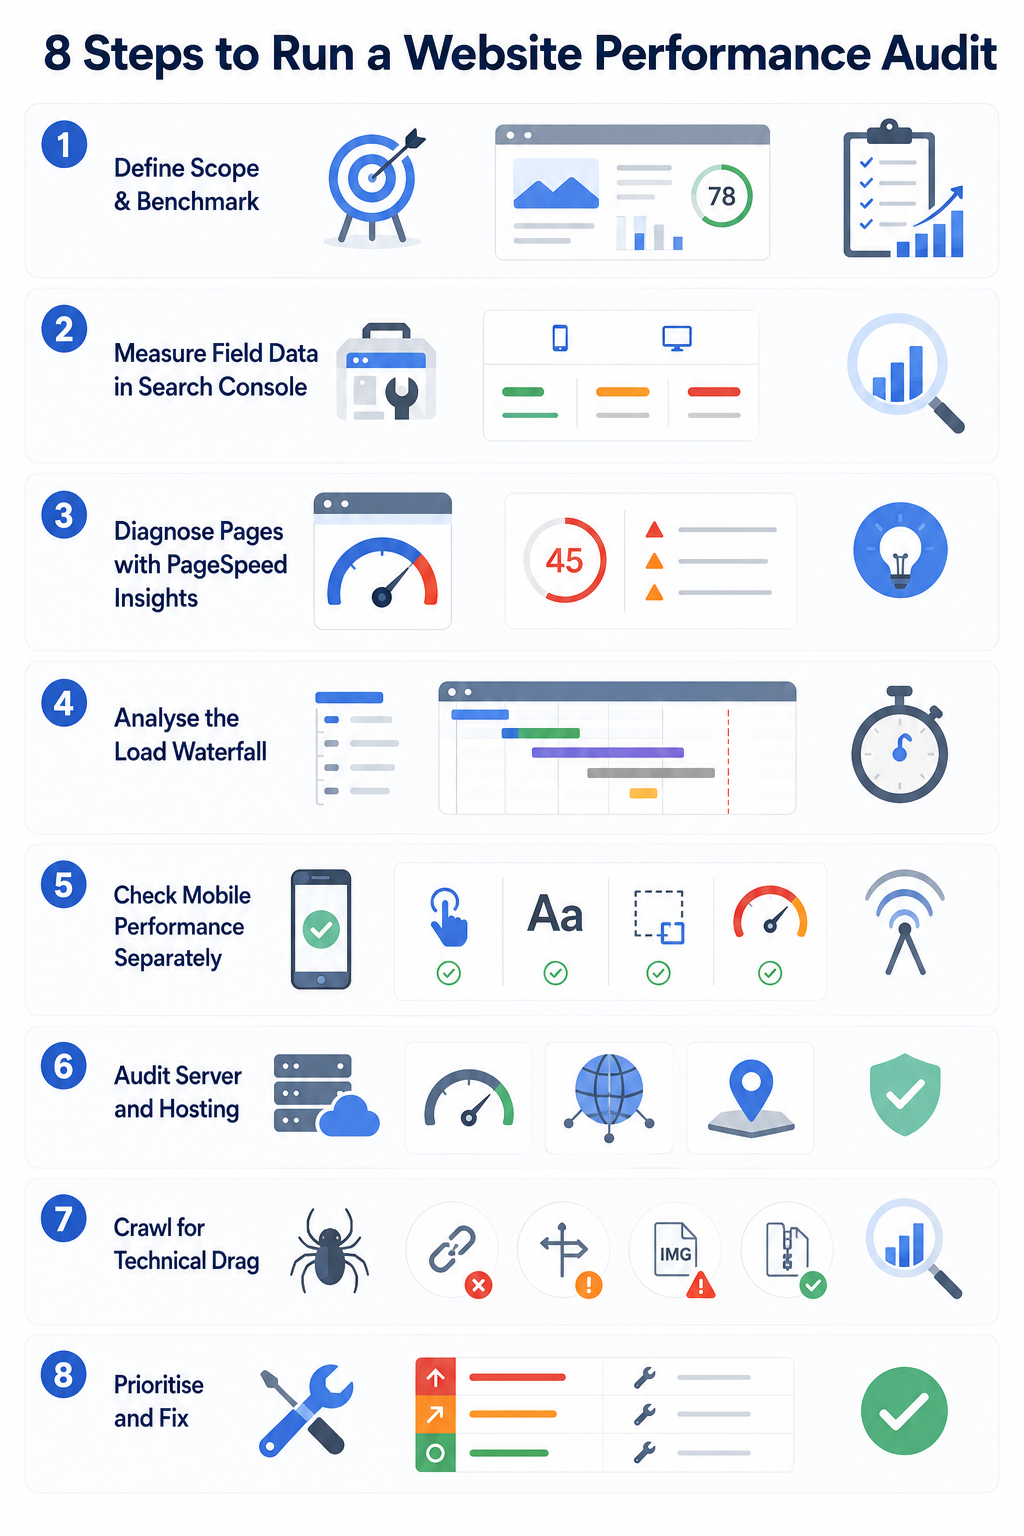
Work through these stages in order. The early steps tell you whether there is a problem; the later ones tell you why.
Step 1: Define Scope and Benchmark
Do not audit every page at once. Pick the pages that matter: homepage, top landing pages, key product or service pages, and the checkout or contact flow. Record current scores for each so you can prove improvement later. For large sites, audit the top 20% of pages by traffic first.
Step 2: Measure Field Data in Search Console
Open the Core Web Vitals report in Google Search Console. This is real-user data grouped into Good, Needs Improvement, and Poor, split by mobile and desktop. Start here because it tells you what Google actually sees. Note which URL groups are failing and on which metric.
Step 3: Diagnose Individual Pages with PageSpeed Insights
Run each priority URL through PageSpeed Insights. Read two things: the field data at the top (the verdict) and the “Diagnostics” and “Opportunities” below (the lab-based fix list). Common opportunities include “reduce unused JavaScript,” “properly size images,” “eliminate render-blocking resources,” and “serve images in next-gen formats.”
Step 4: Analyse the Load Waterfall
Use GTmetrix or the DevTools Network tab to see the request waterfall: every file the page loads, in order, with timing. This reveals the real bottlenecks: a 2MB hero image, a slow third-party script, render-blocking CSS, or too many separate requests. The waterfall is where vague scores become specific culprits.
Step 5: Check Mobile Performance Separately
Mobile is the priority, not an afterthought. Test on a throttled mobile connection (DevTools lets you simulate “Slow 4G”). Confirm tap targets are spaced, text is readable without zooming, and nothing reflows as the page loads. Mobile scores are almost always lower than desktop, and mobile is where most Singapore traffic lives.
Step 6: Audit Server and Hosting
A slow TTFB (over 0.8s) points to server or hosting problems, not front-end code. Check your hosting plan, whether you use caching, and whether a content delivery network (CDN) serves your assets. For a Singapore audience, a server or CDN edge located in or near Singapore reduces latency. See our guide on choosing the right web hosting if this is where your bottleneck sits.
Step 7: Crawl for Technical Drag
Run a crawler (Screaming Frog) to surface site-wide issues that slow things down or waste crawl budget: broken links (404s), redirect chains, oversized pages, and missing compression. Fix or redirect broken links and flatten redirect chains.
Step 8: Prioritise and Fix
Sort findings by impact and effort. Errors and Core Web Vitals failures come first; minor notices come last. The table below maps the most common findings to their fixes.
Common Performance Problems and How to Fix Them
|
Symptom |
Likely cause |
Fix |
|
High LCP |
Large hero image, slow server, render-blocking CSS |
Compress and lazy-load images, use next-gen formats (WebP/AVIF), preload the LCP image, improve hosting |
|
High INP |
Heavy JavaScript blocking the main thread |
Reduce and defer JS, break up long tasks, remove unused scripts and plugins |
|
High CLS |
Images/ads without set dimensions, late-loading fonts |
Set width and height on media, reserve space for ads, preload fonts |
|
Slow TTFB |
Weak hosting, no caching |
Upgrade hosting, enable server and page caching, add a CDN |
|
Too many requests |
Unoptimised plugins, multiple scripts |
Combine/minify CSS and JS, remove unused plugins, lazy-load below-the-fold assets |
|
Large page weight |
Uncompressed images, bloated code |
Compress images, enable Gzip/Brotli, minify code |
For a deeper treatment of the speed fixes specifically, see our guide on website speed optimisation. Many of these issues are exactly what ongoing website maintenance is meant to catch before they hurt you.
Quick Performance Audit Checklist
Use this as a fast pass. Each item should pass before you call a page healthy.
- LCP under 2.5s on mobile (field data)
- INP under 200ms
- CLS under 0.1
- TTFB under 0.8s
- All images compressed and in WebP or AVIF where possible
- Below-the-fold images lazy-loaded
- CSS and JavaScript minified; unused code removed
- Server and browser caching enabled
- CDN serving static assets
- No broken links or redirect chains on key pages
- Mobile layout stable, readable, and tappable
- HTTPS valid across the whole site
For the broader site health view beyond speed, pair this with our website maintenance checklist and technical SEO guide.
How Often Should You Run a Performance Audit
- Small sites (under 50 pages): a full audit at least once a year, plus a quick monthly check of key pages.
- Larger or e-commerce sites: two to three times a year, with continuous monitoring on the homepage and checkout.
- After any major change: always re-audit after a redesign, migration, new plugin, or a marketing campaign that adds heavy tracking scripts.
Performance degrades gradually as content, plugins, and tracking pile up, so treat auditing as a recurring habit, not a one-time event.
DIY or Hire a Specialist
The free tools make a basic audit accessible to any business owner, and you should run one regardless. The judgement call comes at the fix stage. Diagnosing a failing Core Web Vital often means digging into server configuration, render-blocking resources, or third-party scripts, which is where many DIY efforts stall.
If your audit surfaces issues you cannot resolve, or if speed problems are costing you rankings and conversions, it is usually faster to bring in a team. MediaPlus has maintained and optimised more than 1,000 websites since 2013 with an in-house Singapore team, covering performance, SEO, and ongoing maintenance.
Frequently Asked Questions
What is a good website loading speed?
Aim for an LCP under 2.5 seconds on mobile using real-user (field) data. As a rough rule, a full page load under three seconds keeps most visitors engaged.
What is the difference between a performance audit and an SEO audit?
A performance audit focuses on speed, responsiveness, and technical health. An SEO audit is broader, also covering content, keywords, backlinks, and on-page elements. Performance is one important input into SEO.
Do Core Web Vitals really affect Google rankings?
Yes. They are part of Google’s page experience signals. They will not outrank great content on their own, but between two similar pages, the faster, more stable one has the advantage.
Why is my PageSpeed score different each time I test it?
Lab scores vary with network conditions and server load at the moment of testing. This is why field data in Search Console, averaged over 28 days of real users, is the more reliable verdict.
Can good hosting fix a slow website?
Better hosting fixes server-side slowness (a high TTFB) but not front-end problems like oversized images or heavy JavaScript. A proper audit tells you which layer your bottleneck is on before you spend money.
Turning the Audit Into Results
A performance audit is only useful if it leads to fixes. Measure your priority pages against the Core Web Vitals thresholds, work through the waterfall to find the real bottlenecks, fix the highest-impact issues first, then re-measure to confirm the gain. Repeat it on a schedule so new bloat never gets the chance to settle in.
If you would rather have specialists run the audit and implement the fixes, MediaPlus offers performance optimisation as part of its website maintenance services. Get in touch for a performance review of your site.