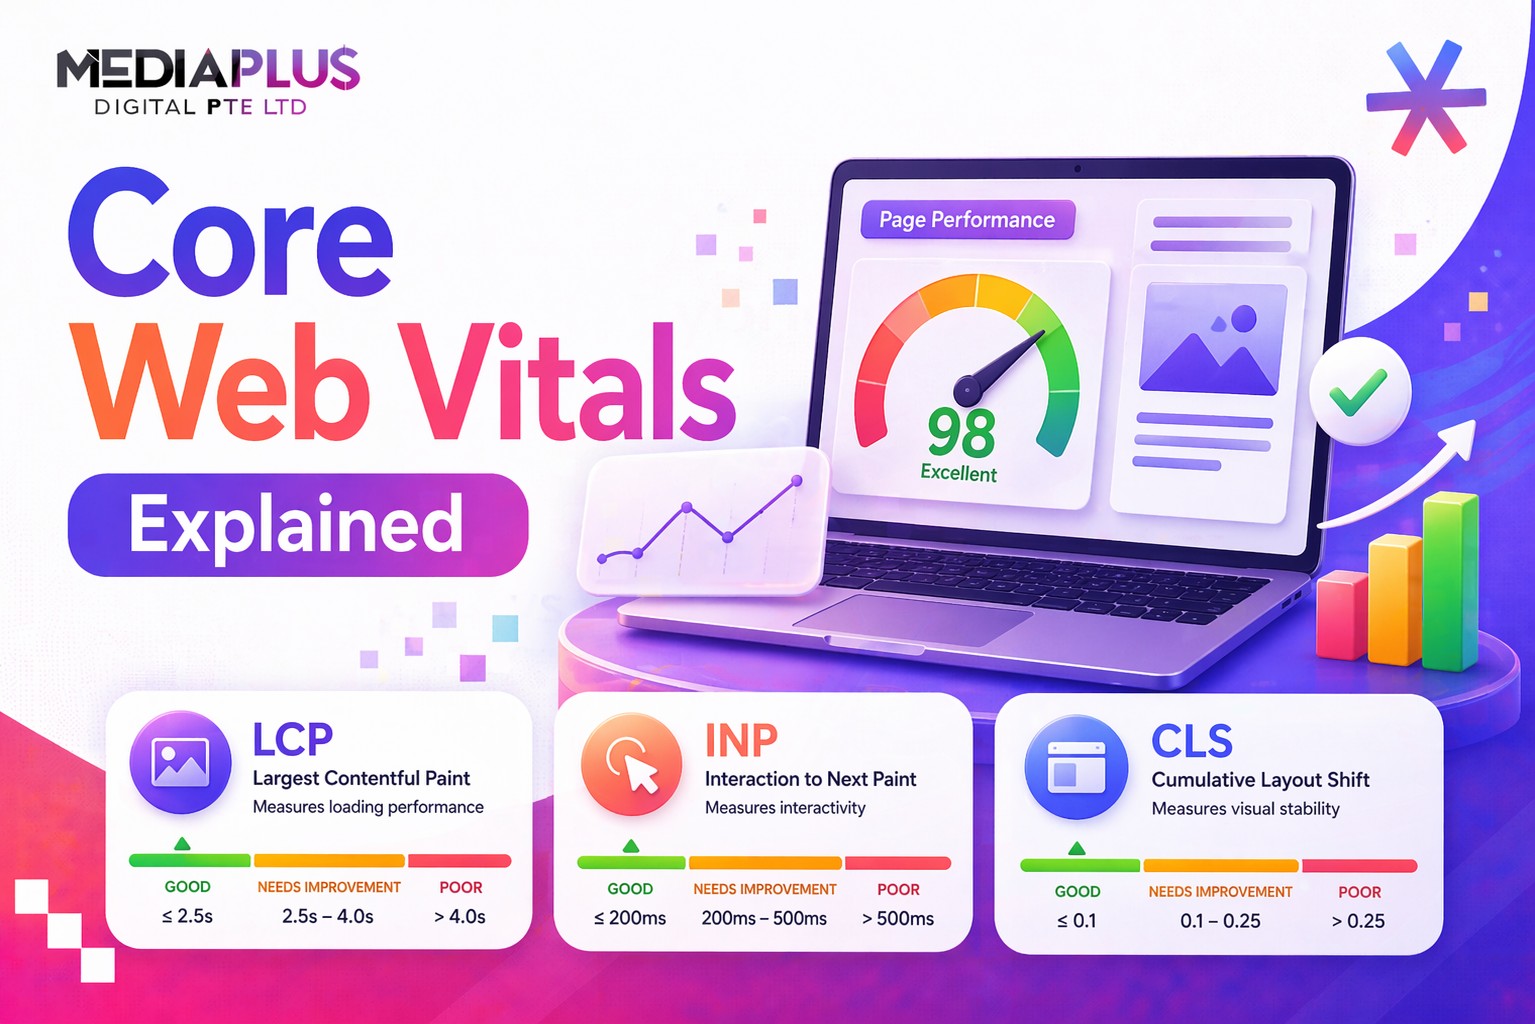
Core Web Vitals are Google’s set of metrics for measuring real-world user experience on the web. They focus on three aspects of the user experience that matter most: loading speed, interactivity, and visual stability.
Since becoming a ranking factor, Core Web Vitals have moved from a developer concern to a business priority. Research shows that sites meeting all three “good” thresholds see measurable improvements in engagement, conversions, and search visibility. In this guide, we explain each metric clearly, show you how to measure them, and provide step-by-step fixes.
What Are Core Web Vitals?
Core Web Vitals are three specific metrics that Google uses to evaluate page experience:
|
Metric |
Full Name |
Measures |
Good Threshold |
|
LCP |
Largest Contentful Paint |
Loading performance |
Under 2.5 seconds |
|
INP |
Interaction to Next Paint |
Responsiveness to user input |
Under 200ms |
|
CLS |
Cumulative Layout Shift |
Visual stability during loading |
Under 0.1 |
Google evaluates Core Web Vitals using real-world user data collected through the Chrome User Experience Report (CrUX). A page “passes” a metric when at least 75% of its visits fall within the “good” threshold.
Why Google Created Core Web Vitals
Google wants to surface pages that are not only relevant but also pleasant to use. Before Core Web Vitals, there was no standardised way to measure user experience at scale. These metrics give website owners clear, measurable targets to aim for, and Google a consistent signal for ranking decisions.
Core Web Vitals as a Ranking Factor
Core Web Vitals became a mobile ranking factor in June 2021 and expanded to desktop in February 2022. Google’s own documentation states that page experience signals “align with what our core ranking systems seek to reward.”
Research by Sistrix found that pages passing all three Core Web Vitals had 3.7% higher search visibility than those failing. While content relevance remains the strongest ranking factor, Core Web Vitals serve as a tiebreaker in competitive SERPs.
How CWV Fit Into Page Experience Signals
Core Web Vitals are part of a broader set of page experience signals that Google considers:
- Core Web Vitals (LCP, INP, CLS)
- Mobile-friendliness
- HTTPS security
- No intrusive interstitials (pop-ups that block content)
The Three Core Web Vitals Metrics Explained
Largest Contentful Paint (LCP): Loading Performance
LCP measures how long it takes for the largest visible content element to appear on screen. This is usually the hero image, main heading, or a large video thumbnail. It represents the moment a user feels the page has “loaded” its main content.
|
Rating |
Threshold |
What Users Experience |
|
Good |
Under 2.5 seconds |
Content appears quickly; user feels the page is fast |
|
Needs Improvement |
2.5 – 4.0 seconds |
Noticeable delay; user may start to lose patience |
|
Poor |
Over 4.0 seconds |
Significant delay; high risk of user abandoning the page |
What Counts as the LCP Element?
- Images (including background images via CSS)
- Video poster images (thumbnails)
- Block-level text elements (headings, paragraphs)
- SVG elements within <svg> tags
LCP Sub-Parts
LCP can be broken down into four phases. Optimising each phase has a different approach:
1. Time to First Byte (TTFB): How fast your server responds. Fix with better hosting, server-side caching, and CDN.
2. Resource Load Delay: Time between TTFB and the browser starting to load the LCP resource. Fix by preloading the LCP image and removing render-blocking resources.
3. Resource Load Duration: How long the LCP resource takes to download. Fix by compressing images, using WebP/AVIF, and responsive image sizes.
4. Element Render Delay: Time between the resource downloading and actually rendering. Fix by removing CSS that delays rendering and reducing JavaScript execution.
Interaction to Next Paint (INP): Responsiveness
INP measures how quickly your page responds to user interactions (clicks, taps, keyboard input). It replaced First Input Delay (FID) in March 2024 because FID only measured the first interaction, while INP captures the responsiveness of all interactions throughout the page lifecycle.
|
Rating |
Threshold |
What Users Experience |
|
Good |
Under 200ms |
Interactions feel instant and responsive |
|
Needs Improvement |
200 – 500ms |
Slight lag noticed; interface feels sluggish |
|
Poor |
Over 500ms |
Noticeable delay; users may click repeatedly or abandon |
Common Causes of Poor INP
- Heavy JavaScript execution blocking the main thread.
- Long tasks (any JavaScript task taking over 50ms) that delay event handling.
- Third-party scripts (analytics, chat widgets, ad scripts) competing for CPU time.
- Complex DOM manipulations triggered by user interactions.
- Unoptimised event handlers that do too much work synchronously.
Cumulative Layout Shift (CLS): Visual Stability
CLS measures how much visible content shifts unexpectedly during loading. You have experienced bad CLS if you have ever tried to click a button and the page suddenly shifted, causing you to click something else instead.
|
Rating |
Threshold |
What Users Experience |
|
Good |
Under 0.1 |
Page feels stable; elements stay in place |
|
Needs Improvement |
0.1 – 0.25 |
Occasional shifts noticed; mildly disorienting |
|
Poor |
Over 0.25 |
Frequent, jarring shifts; frustrating and potentially causing misclicks |
Common Causes of Layout Shifts
- Images and videos without explicit width and height attributes.
- Ads, embeds, and iframes that load dynamically without reserved space.
- Web fonts loading and causing text reflow (FOUT: Flash of Unstyled Text).
- Content injected above existing content after initial load (banners, cookie notices).
- Dynamically loaded content that pushes down existing elements.
How Google Measures Your Core Web Vitals
The 75th Percentile Rule
Google does not use your average score. It uses the 75th percentile of all page visits over a 28-day period. This means 75% of your visitors must have a “good” experience for the page to pass. This approach prevents outliers (very fast Wi-Fi users or very slow 3G connections) from skewing results.
Field Data vs Lab Data
|
Aspect |
Field Data |
Lab Data |
|
Source |
Real user visits (CrUX) |
Simulated tests (Lighthouse) |
|
Used for ranking |
Yes |
No (but useful for debugging) |
|
Reflects real conditions |
Yes (device variety, network speeds) |
No (controlled environment) |
|
Available for all pages |
Only pages with enough traffic |
Yes (any page can be tested) |
|
Best for |
Understanding real user experience |
Diagnosing and debugging issues |
For SEO purposes, field data is what matters. Lab data is for finding and fixing the problems that field data reveals.
How to Check Your Core Web Vitals
|
Tool |
Type |
Best For |
|
Google Search Console |
Field data |
Site-wide overview of CWV status across all pages |
|
PageSpeed Insights |
Field + Lab |
Per-page analysis with both real-user data and Lighthouse audit |
|
Chrome DevTools |
Lab data |
Debugging specific performance issues in real-time |
|
CrUX Dashboard (Looker Studio) |
Field data |
Trend analysis over time with historical data |
|
Web Vitals Chrome Extension |
Field data |
Quick check of CWV on any page as you browse |
|
WebPageTest |
Lab data |
Advanced testing from multiple locations (including Singapore) |
How to Improve Each Core Web Vital
Fix LCP: Step by Step
- Audit: Use PageSpeed Insights to identify your LCP element and its current timing.
- Optimise server response: Improve hosting, enable server-side caching, and use a CDN with Singapore PoPs.
- Preload the LCP resource: Add <link rel=”preload”> for the hero image or critical asset.
- Compress images: Convert to WebP or AVIF. Use responsive images with srcset.
- Remove render-blocking CSS/JS: Inline critical CSS, defer non-critical stylesheets.
- Add fetchpriority=”high” to the LCP image element.
Fix INP: Step by Step
- Audit: Use Chrome DevTools Performance panel to identify long tasks during interactions.
- Break up long tasks: Split JavaScript execution into smaller chunks using requestIdleCallback or scheduler.yield().
- Defer third-party scripts: Load analytics, chat widgets, and ads asynchronously or after initial interaction.
- Optimise event handlers: Avoid synchronous DOM manipulation in click/tap handlers. Use requestAnimationFrame for visual updates.
- Reduce JavaScript bundle size: Use code splitting, tree shaking, and dynamic imports.
- Use web workers for heavy computations that do not need DOM access.
Fix CLS: Step by Step
- Set explicit dimensions: Add width and height attributes to all images, videos, and iframe embeds.
- Reserve space for ads and dynamic content: Use CSS min-height on ad containers and embeds.
- Optimise font loading: Use font-display: swap with size-adjust and ascent/descent overrides to prevent text reflow.
- Avoid inserting content above existing content: Place banners, cookie notices, and alerts in fixed positions or at the top of the DOM before other content.
- Use CSS contain: Use CSS containment (contain: layout) on elements that should not affect the layout of siblings.
The Hidden CWV Killers: Third-Party Scripts
Tag managers, analytics scripts, chat widgets, ad platforms, and social media embeds are among the biggest performance drains on modern websites. They affect all three Core Web Vitals:
- LCP: Third-party scripts compete for bandwidth and CPU during critical loading phase.
- INP: JavaScript from third parties can block the main thread, delaying response to user interactions.
- CLS: Dynamically injected ads and chat widgets cause layout shifts when they load.
How to manage them:
- Audit every third-party script. Remove anything not delivering clear value.
- Load non-critical scripts with defer or async attributes.
- Delay chat widgets and ad scripts until after user interaction or a set time delay (e.g., 5 seconds).
- Use a tag manager’s timing controls to sequence when scripts fire.
- Monitor the performance impact of each script using Chrome DevTools or WebPageTest.
Real-World Case Studies
Vodafone: Improved LCP by 31%, resulting in 8% more sales conversions. The primary fix was optimising the hero image loading chain.
Yahoo Japan: Fixed CLS issues, leading to a 15% increase in pageviews per session. Reserving space for ads and fixing font loading were the key changes.
Swappie: Improved Core Web Vitals across the board, resulting in a 42% increase in mobile revenue. The main optimisations were image compression, JavaScript reduction, and server-side rendering.
Renault: CWV improvements contributed to a 13% increase in conversions. Server response time optimisation and CDN implementation were the primary fixes.
Platform-Specific CWV Optimisation
WordPress
- Install a performance plugin (WP Rocket, LiteSpeed Cache) for caching, minification, and lazy loading.
- Use a lightweight theme optimised for performance.
- Limit plugins and audit their performance impact individually.
- Choose managed WordPress hosting with built-in CDN (Cloudways, Kinsta).
Shopify
- Choose a fast theme from the Shopify theme store (Dawn is optimised for speed).
- Minimise app installations; each app adds JavaScript to every page.
- Optimise product images before uploading.
- Use Shopify’s built-in CDN and automatic image compression.
Next.js / React
- Use Server-Side Rendering (SSR) or Static Site Generation (SSG) for critical pages.
- Implement code splitting with dynamic imports to reduce initial bundle size.
- Use Next.js Image component for automatic image optimisation and responsive sizing.
- Monitor hydration performance to prevent INP issues during initial page interaction.
Core Web Vitals Audit Checklist
|
Metric |
Check |
Status |
|
LCP |
Hero image is compressed (WebP/AVIF) and preloaded |
|
|
LCP |
Server response time (TTFB) is under 800ms |
|
|
LCP |
No render-blocking CSS/JS in the critical path |
|
|
LCP |
CDN enabled with Singapore PoP |
|
|
INP |
No long JavaScript tasks (over 50ms) during interactions |
|
|
INP |
Third-party scripts loaded async/deferred |
|
|
INP |
Event handlers optimised for minimal main-thread work |
|
|
CLS |
All images and videos have width/height attributes |
|
|
CLS |
Ad containers have reserved space (min-height) |
|
|
CLS |
Web fonts use font-display: swap with fallback sizing |
|
|
CLS |
No content injected above the fold after load |
|
|
All |
PageSpeed Insights field data shows “Good” for all three metrics |
Frequently Asked Questions
Do Core Web Vitals directly affect rankings?
Yes. Core Web Vitals are a confirmed Google ranking signal since June 2021 (mobile) and February 2022 (desktop). However, content relevance still outweighs page experience. CWV acts as a tiebreaker among pages with similar content quality.
What if my content is great but my CWV scores are poor?
Great content can still rank well despite poor CWV, because content relevance carries more weight. However, improving CWV provides additional ranking advantage and significantly improves user engagement metrics like bounce rate and conversion rate.
How long until CWV improvements show in Search Console?
Google’s CrUX data is collected over a rolling 28-day period. After making improvements, expect to see changes reflected in Search Console within 28-30 days. Larger sites may see changes slightly faster due to higher traffic volumes.
Mobile vs desktop: which matters more?
Google primarily uses mobile Core Web Vitals for ranking because of mobile-first indexing. However, both mobile and desktop CWV are tracked and reported. Optimise for mobile first, then verify desktop performance.
Do Core Web Vitals apply to pages with noindex?
Google tracks CWV for all pages served to Chrome users via CrUX, including noindexed pages. However, since noindexed pages do not appear in search results, their CWV do not affect your search rankings.
What is the difference between field data and lab data?
Field data comes from real users visiting your site (collected via CrUX). Lab data comes from simulated tests (Lighthouse, WebPageTest). Google uses field data for ranking decisions. Use lab data for debugging and testing fixes before deployment.
Key Takeaways
- Core Web Vitals (LCP, INP, CLS) are Google’s standardised metrics for user experience and a confirmed ranking factor.
- LCP measures loading (target: under 2.5s). INP measures responsiveness (target: under 200ms). CLS measures visual stability (target: under 0.1).
- Google uses the 75th percentile of real-world field data, not lab data, for ranking.
- Third-party scripts are the most common hidden cause of poor CWV scores.
- Real-world case studies show measurable business impact: Vodafone (8% more sales), Yahoo Japan (15% more pageviews), Swappie (42% more mobile revenue).
- Use PageSpeed Insights for quick audits, Search Console for site-wide monitoring, and Chrome DevTools for debugging.
- Platform-specific optimisation matters: WordPress, Shopify, and React/Next.js each have unique considerations.
Need Help With Core Web Vitals?
At MediaPlus Digital, we build and optimise websites with Core Web Vitals performance built in from day one. Our Singapore-based team can audit your site, identify performance bottlenecks, and implement fixes that improve both your user experience and search rankings.
Explore our web design services or read more about SEO-friendly web design.